Google's PageSpeed Insights Doesn't Tell the Whole Story
Published: 02/13/2025
Google's PageSpeed Insights Don’t Tell the Full Story: Understanding Core Web Vitals and What It is Missing
While there are many page speed testing tools, this article focuses specifically on Google PageSpeed Insights (PSI).
Let’s start with which factors are actually used to determine PageSpeed Insight's Core Web Vitals, and what context is missing (like advanced pre-fetching, single page applications, etc). Since speed is something that is getting widely discussed lately, and on LinkedIn, we thought we’d help shed some light on the topic.
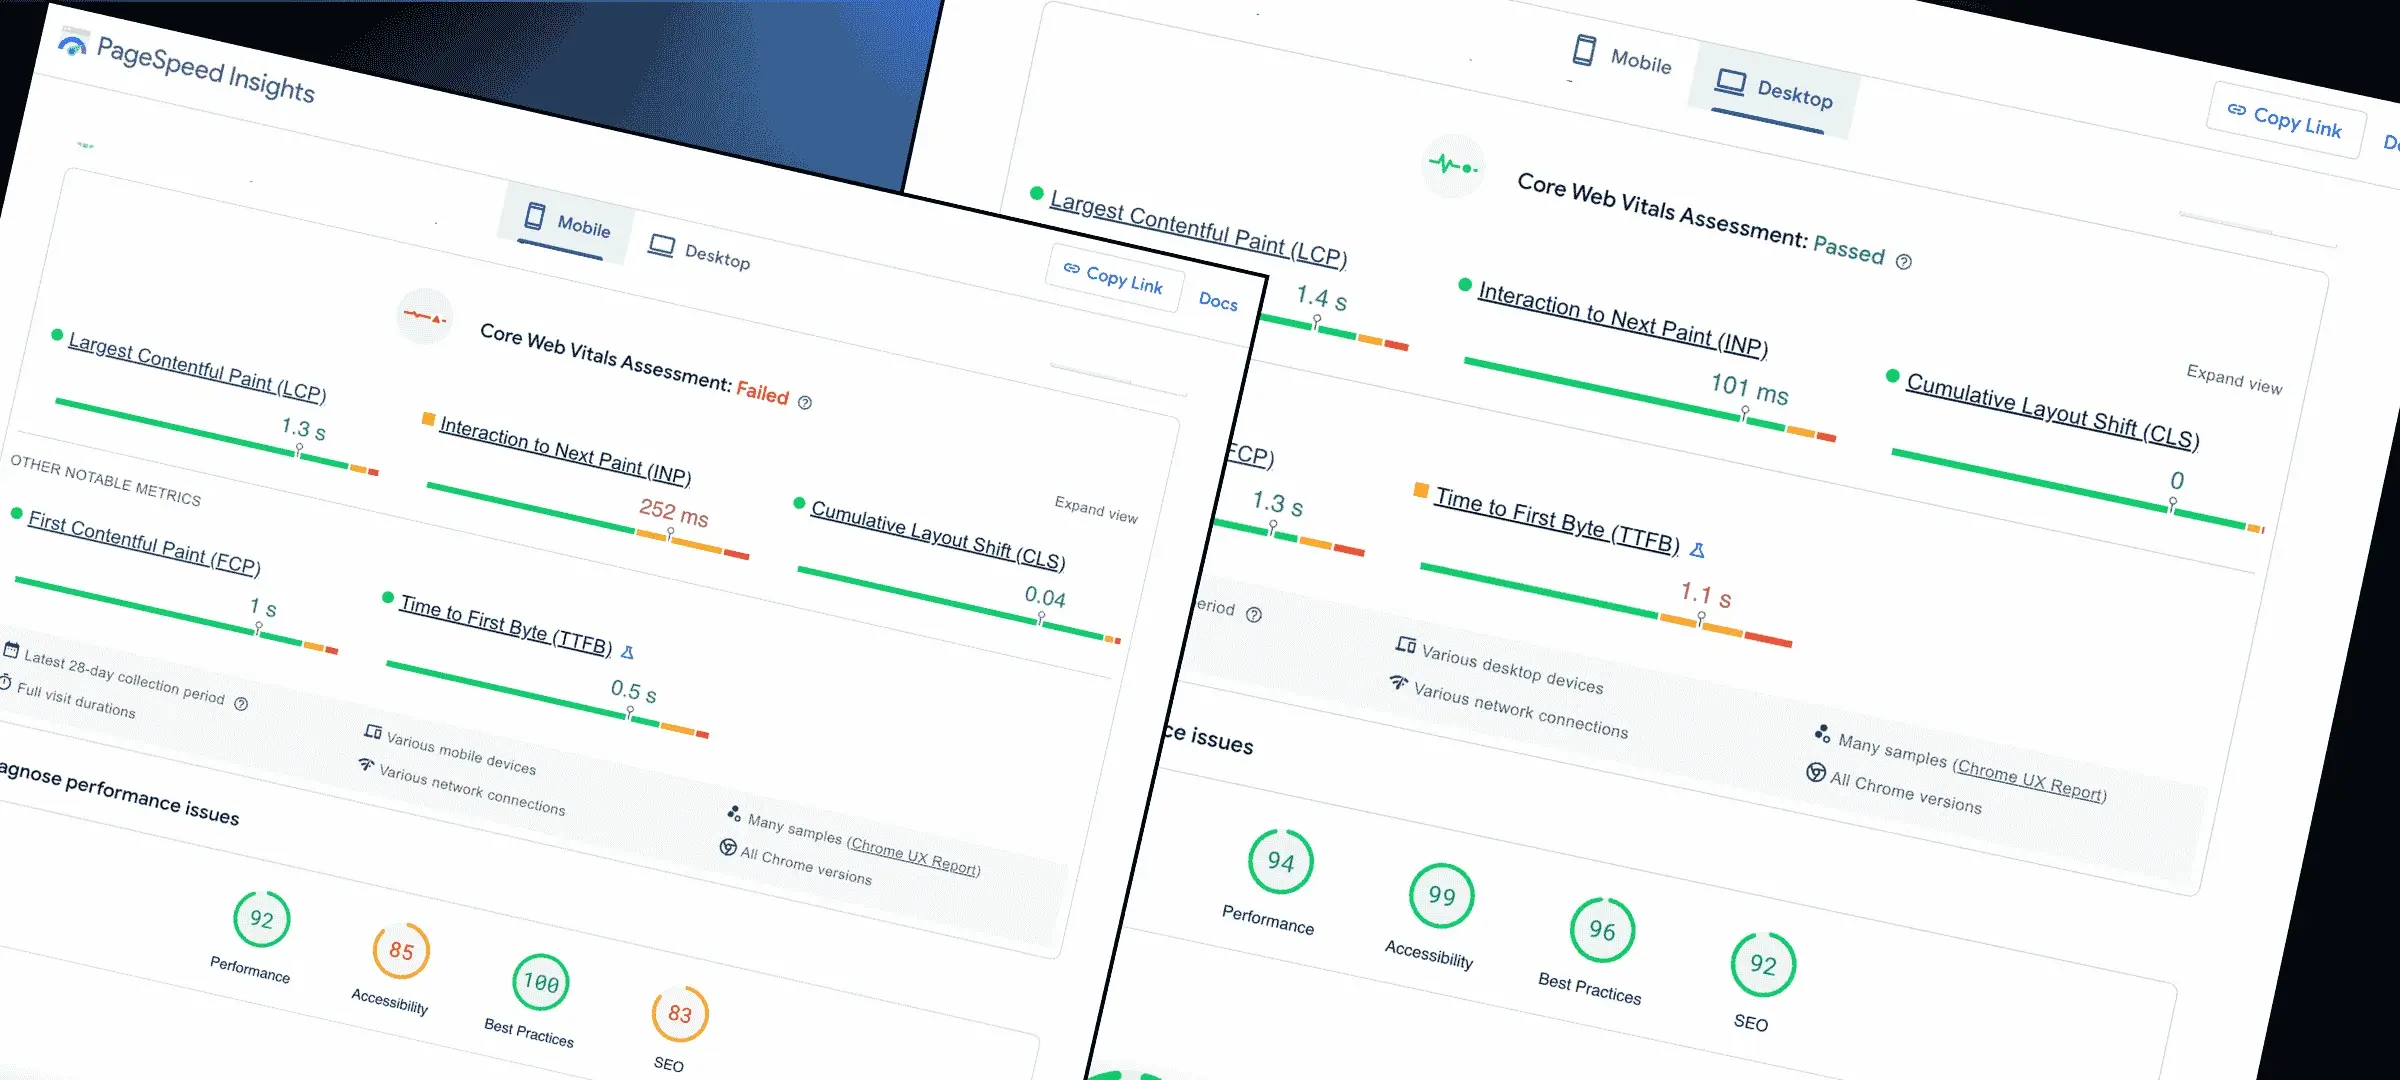
The top section of results on PageSpeed Insight reports are the Core Web Vitals; LCP (Largest Contentful Paint), INP (Interaction to Next Paint), and CLS (Cumulative Layout Shift). These are accurate for measuring speed factors in a real-world user experience – for those using Google Chrome. The bottom performance metrics are lab simulated.
It’s important to note it only collects data for Core Web Vitals from actual Chrome users (Chrome User Experience Report - CrUX). This means the results reflect how visitors using that browser type experience your site.
Core Web Vitals (CWV) metrics like LCP, CLS, and INP primarily focus on a single page load—or, in the case of INP, a single page’s interactions. Because of that, certain performance enhancements that kick in after the initial page load or across multiple navigations often aren’t reflected in CWV scores.
Below are a few examples of technologies that can dramatically improve the user experience once visitors begin moving through a site, but don’t necessarily show up in PSI or single-page metrics.
Limitations explained:
- Data from Safari, Firefox, or Edge, etc is not factored in.
- While Google Chrome accounts for 67% of the global web browser market share as of Jan 2025, it’s still important to know it’s not a full picture.
- Not all website technologies are factored in – Team MXS’s Dealer Masters’ platform utilizes advanced pre-fetching technology, which loads key content before a user switches pages, and is not fully measured by Google PageSpeed Insights.
- Google PageSpeed Insights (PSI) analyzes individual pages, not an entire website.
- For automotive dealerships, the homepage, typically what is input into PSI, receives less traffic than the Search Results Page (SRP) or Vehicle Display Pages (VDP), where shoppers spend most of their time, so assessing each page uniquely is vital.
That being said, page speed is an increasingly make-or-break factor for automotive websites to successfully deliver more content, engaging experiences, SEO and to allow third party tools to perform better, so any data to improve and keep in check is helpful, but the limitations need to be known.
Since PSI doesn’t account for things like advanced pre-fetching, a key technology our platform employs to deliver app-like experiences, let’s explain it a bit…
____
Pre-Fetching and Pre-Loading Technology
What it is: The site anticipates which page or resource the user is likely to visit next, fetching them in the background, so when they do interact, the content loads almost instantly.
How it helps: When the user clicks to the next page, much of the data is already loaded locally, resulting in near-instant transitions. However, since PSI only measures one page at a time, these follow-up navigations aren’t always captured.Basically, pre-fetching and pre-loading is a web optimization technique that loads key resources before a user actually needs them, reducing wait times and making sites feel significantly faster…more like an “app” experience.
This also enables our sites to continue to download content as they browse – so their experience actually gets faster the longer they’re on the site. While we’ll still outperform competitors in speed under standardized, equal testing, our sites work in a way Google does not account for fully.
This is especially true for INP (Interaction to Next Paint). Normally, when a user switches pages, Google resets INP, but because our site is a Single Page Application (SPA), Google mistakenly interprets the page change as an INP event, unfairly penalizing our score.
____
Single Page Applications (SPAs)
What it is: Instead of loading new HTML each time, SPAs dynamically update parts of the page using JavaScript.
How it helps: After the initial load, navigation is much faster because you’re not doing a full page refresh. But tools like PageSpeed Insights can interpret these navigation events differently (or even penalize them) since they’re not full page loads.
It’s important to note for automotive dealership website builds that we also pre-calculate every possible SRP filter combination, which is not factored into PageSpeed Insights and adds immense value to the online car shopping experience.
It all boils down to the fact that Team MXS builds websites and a platform that help dealers engage shoppers, get more conversions, lower CPCs, boost SEO, and strengthen their brand’s first impression—not just check a Core Web Vitals box. While CWV scores play their part in analyzing a site's performance, the limitations of measuring those scores and those additional factors which play a role in delivering leads have to be considered together.
Now let’s dive into what actually makes up Core Web Vitals, their impact and ideal scores.
____
Largest Contentful Paint (LCP)
Impact: The biggest element on your page—usually a featured car image, hero banner, special promotion or inventory —need to load fast. If shoppers have to stare at a blank or half-loaded screen while waiting to see the vehicle they’re interested in, they’ll likely bounce before they even start browsing.
Ideal Score: Under 2.5 seconds
Average: 2.5 seconds on desktop, 8.6 seconds on mobile
____
Cumulative Layout Shift (CLS)
Impact: Ever try to click "Get Pre-Approved" but suddenly it moves because something else just loaded? That’s CLS. If your website shifts around while people are clicking on buttons like "Schedule a Test Drive" or "View Inventory," it creates a frustrating shopping experience and leads to lost conversions.
Ideal Score: Under 0.1s
Average: Varies widely; many dealer sites struggle with shifting layouts due to variations in third party add-ons and pop-ups used.
____
Interaction to Next Paint (INP)
Impact: INP measures how quickly a page responds to user actions like clicks and taps. Slow INP can make a site feel unresponsive, frustrating shoppers trying to browse inventory or submit leads. SPAs and heavy JavaScript (ie: chat tools, finance calculators) can falsely inflate INP scores.
Ideal Score: Under .2s
Average: .3 - .5s on desktop ,.5 s+ on mobile
Note: Other metrics can also be affected by third-party plugins too, but INP scrutinizes third-party plugins like live chat, pop-ups, and form fields. Every interaction—whether a chat prompt or lead form—is measured, and even minor delays can negatively impact INP scores. This means the third-party tools a dealership uses could be hurting website performance, regardless of other optimizations. This is one reason we try to consult with our dealer clients on using minimal third party tools and only ones that prove to help conversions.
There are a couple other factors PSI reports include that don’t add to Core Web Vitals, but are important to also understand.
____
First Contentful Paint (FCP)*
*Does not determine if a site passes Core Web Vitals
Impact: When a shopper lands on your site, the first thing they should see is your logo, vehicle images, or a headline. If these take too long to load, they might assume your site is broken or slow and leave to check out a competitor's inventory instead.
Ideal Score: Under 1.8 seconds
Average: 2.5 seconds on desktop, 8.6 seconds on mobile
____
Time to First Byte (TTFB)*
*Does not determine if a site passes Core Web Vitals
Impact: TTFB measures how long it takes for a browser to receive the first byte of data from a server. For automotive dealership websites, high TTFB can be caused by slow server response times, overloaded third-party scripts, or complex inventory feeds. A slow TTFB can delay page rendering, making the site feel sluggish before shoppers even see content.
Ideal Score: Under .8s
Average: 1.5s on desktop, 2.5s+ on mobile
____
Ok, But Why Do These (and Speed) Matter for Your Dealership’s Website?
✅ Higher Rankings – Google prioritizes fast-loading sites, meaning better visibility for your dealership. That’s more bang for your buck & effort for all SEO initiatives!
✅ More Engaged Shoppers – Fast-loading inventory and media rich model pages mean more time browsing cars and less frustration.
✅ Lower CPCs - People that click on paid ads have higher conversions (often double) when landing on faster, better UX’d pages. Plus, Meta and Google both add priority / value to these factors!
✅ Better Mobile Experience – The majority of car shoppers browse on their phones. A slow site = lost traffic and sales.
✅ Lifts for 3rd Party Tools - Give your integrations the most optimal environment to perform and maybe even see lifts in their performances.
✅ More Content - Faster sites mean you can display more 4k images, videos and content to help educate and engage shoppers.
Speed isn’t just a number — it’s the enhanced experiences that speed allows car dealers to help drive their online presence, content, tools and leads.
Bottom Line…
Google’s PageSpeed Insights with Core Web Vitals provide an accurate benchmark of user experience for Chrome users, but they do not tell the full story or account for modern technological advancements that affect speed and experience.
Team MXS’ Dealer Masters platform’s advanced optimizations ensure our dealership sites perform even better in real-world browsing than PSI scores suggest.
If you want to be one of the fastest and most engaging, content rich dealership websites in auto that focuses on real world experiences…let’s talk! (But be quick because development slot cycles for new clients are filling up FAST for the next few months. 😎)